Political party colours
Zoe Meers
14/10/2019
Source:vignettes/political_parties.Rmd
political_parties.RmdSometimes you want to colour points or lines by political parties i.e. Republicans and Democrats or ALP/Coalition/Greens. To make this easy to do, I have stored party information in ussc_colours. To access the colours as a vector, run ussc_pal$auspol or ussc_pal$uspol. If you want to use the colours in a ggplot2 object, simply create your graph and append scale_colour_ussc("auspol") or scale_fill_ussc("auspol") to the object.
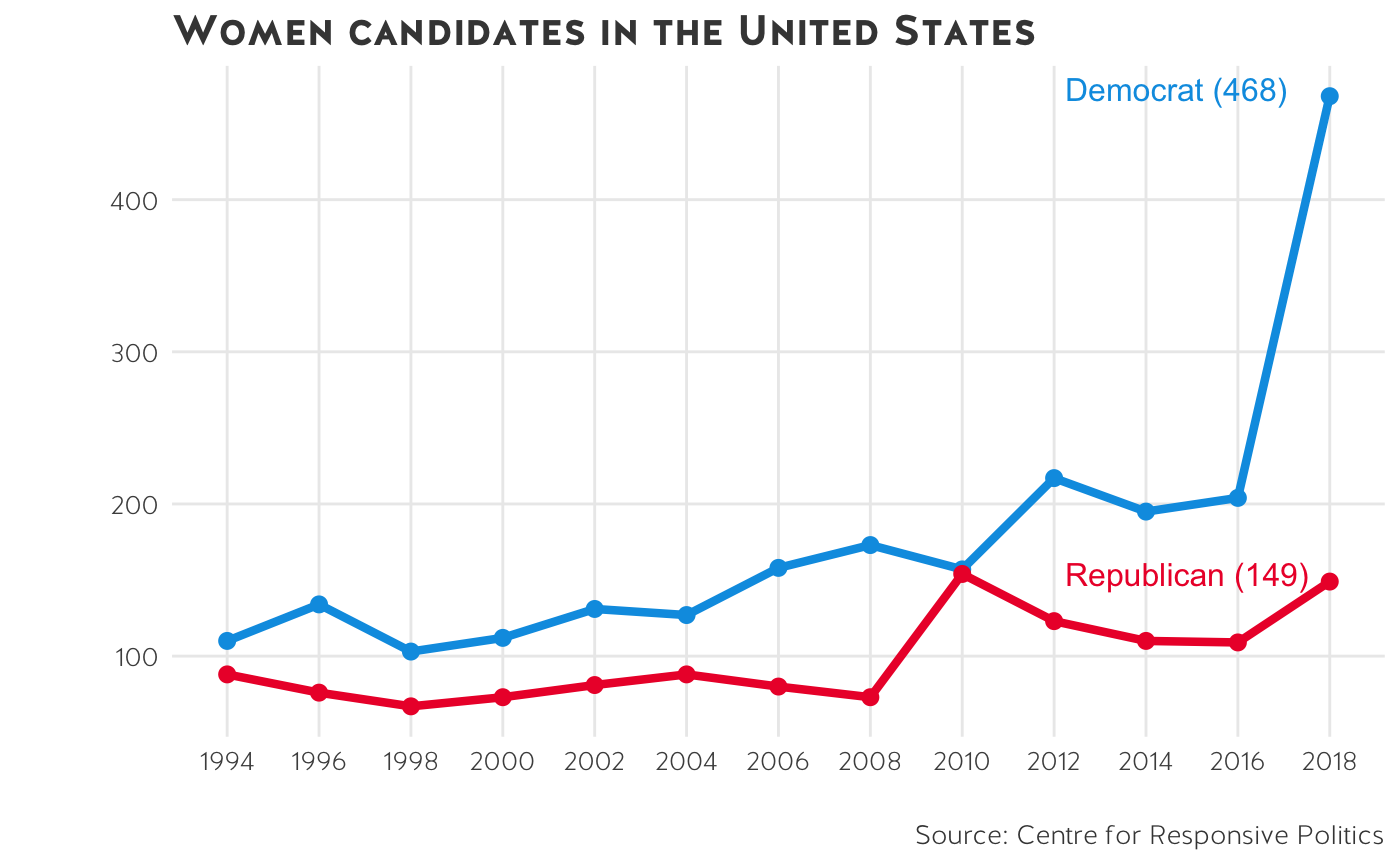
label <- read.csv("candidates_midterms.csv")%>%
  filter(Cycle == "2018")

read.csv("candidates_midterms.csv") %>%
  ggplot() +
  geom_line(aes(Cycle, Female.Candidates, colour = party), size = 1.5) +
  geom_point(aes(Cycle, Female.Candidates, colour = party), size = 2.5) +
  theme_ussc() +
  directlabels::geom_dl(
    data = label, aes(Cycle, Female.Candidates,
      label = paste0(party, " (", Female.Candidates, ")"),
      colour = party
    ),
    method = list(directlabels::dl.trans(x = x - 3.5, y = y + .1),
      "last.points",
      cex = 1
    )
  ) +
  scale_colour_ussc("uspol") +
  theme(
    legend.position = "none",
    panel.grid.minor = element_blank()
  ) +
  scale_x_continuous(breaks = seq(1994, 2018, 2)) +
  labs(
    title = "Women candidates in the United States",
    y = "", colour = "", x = "",
    caption = "Source: Centre for Responsive Politics"
  )